Overview
A running census of new residential construction in the City of Austin's full-purpose jurisdiction, 2016–2026. It pairs the City of Austin permit system (updated daily: what was permitted) with the Travis Central Appraisal District roll (certified annually: what was built). Use the toggle at the top right to switch between the last 12 months and the full window.
Where the market stands
Austin issued permits for 6,485 new homes in the twelve months to October 2026, against 8,583 the year before — -24%. Multifamily is 75% of that.
Since 2016, Austin has permitted 137,981 new homes inside the full-purpose city limits, 79% of them multifamily. Volume peaked in 2022 at 18,873 homes and has run below that since.
Production
Homes permitted
New dwelling permits issued inside the full-purpose jurisdiction. Demolitions, relocations, remodels and additions are excluded, as are permits whose authorisation was later withdrawn or voided. High-rise towers permitted as shell buildings are counted, sized from their residential finish-out permits. 2026 is a partial year: the by-year figures run through October 2026 only.
Homes permitted
by month · Nov 2026 in progress, excluded by yearThe numbers
| Month | Permits | Homes | Single family | Multifamily |
|---|---|---|---|---|
| Nov 2025 | 86 | 89 | 77 | 12 |
| Dec 2025 | 147 | 866 | 122 | 744 |
| Jan 2026 | 145 | 158 | 138 | 20 |
| Feb 2026 | 120 | 327 | 113 | 214 |
| Mar 2026 | 156 | 360 | 152 | 208 |
| Apr 2026 | 156 | 164 | 145 | 19 |
| May 2026 | 156 | 767 | 125 | 642 |
| Jun 2026 | 183 | 355 | 157 | 198 |
| Jul 2026 | 184 | 833 | 163 | 670 |
| Aug 2026 | 150 | 1,128 | 132 | 996 |
| Sep 2026 | 122 | 514 | 108 | 406 |
| Oct 2026 | 197 | 924 | 166 | 758 |
| Year | Permits | Homes | Single family | Multifamily |
|---|---|---|---|---|
| 2016 | 3,694 | 9,820 | 3,336 | 6,484 |
| 2017 | 4,125 | 10,055 | 3,812 | 6,243 |
| 2018 | 4,077 | 11,188 | 3,646 | 7,542 |
| 2019 | 4,213 | 16,759 | 3,714 | 13,045 |
| 2020 | 3,550 | 18,509 | 3,113 | 15,396 |
| 2021 | 3,363 | 16,883 | 3,038 | 13,845 |
| 2022 | 2,956 | 18,873 | 2,550 | 16,323 |
| 2023 | 1,862 | 13,637 | 1,538 | 12,099 |
| 2024 | 1,566 | 8,329 | 1,367 | 6,962 |
| 2025 | 1,770 | 8,339 | 1,349 | 6,990 |
| 2026 | 1,599 | 5,589 | 1,426 | 4,163 |
Form mix, 2016–2026
Apartments and detached houses are the market. Everything between them — attached single-family homes, duplexes, 3–4 unit buildings and accessory units — totals 7,548 homes, 5.5% of the window.
Infill & missing middle
The small-scale forms, and what HOME did to them
Everything between a detached house and a 5+ apartment building: accessory units, duplexes, 3–4 unit buildings and attached single-family homes (townhouses and rowhouses). Austin files those under the same Census class as detached houses, so this counts them from the permit description — 1,635 homes the structure code alone would miss. Measured in homes, not permits: from 2025 the duplex halves are permitted individually, so permit counts inflate while units stay honest.
Missing-middle homes permitted
share of all homes below each yearThe category boundary moved, so read the total, not the colors. HOME Phase 1 made additional units allowed by right rather than "accessory", and the permit classes followed: ADU permits fall from 247 homes in 2023 to 11 in 2025, while duplex rises from 139 to 406. That is one category emptying into another, not accessory units ceasing to be built.
Small secondary units, through the relabeling
Floor area separates the two, because the building did not change when its category did. Splitting two-family permits at 1,466 sq ft per unit — the size of a pre-HOME ADU — shows what actually happened: units permitted as ADUs fall from 245 to 9, ADU-sized two-family rises from 14 to 220, and genuine duplex construction barely moves (123 to 158). Small secondary units are not down 96%; taken together they are down 12% on 2023.
Post-HOME these are not ADUs in the regulatory sense — that status no longer exists. This is a physical category: small secondary units on a lot. 2026 is partial and reads low.
By year
| Year | Homes | % of all homes | ADU | Duplex | 3–4 unit buildings | Attached single-family | Permits |
|---|---|---|---|---|---|---|---|
| 2016 | 727 | 7 | 232 | 312 | 15 | 168 | 565 |
| 2017 | 900 | 9 | 358 | 264 | 69 | 209 | 721 |
| 2018 | 961 | 9 | 342 | 421 | 94 | 104 | 768 |
| 2019 | 1,079 | 6 | 384 | 306 | 74 | 315 | 883 |
| 2020 | 823 | 4 | 333 | 192 | 70 | 228 | 681 |
| 2021 | 767 | 4 | 346 | 188 | 36 | 197 | 648 |
| 2022 | 650 | 3 | 331 | 155 | 61 | 103 | 533 |
| 2023 | 566 | 4 | 247 | 139 | 51 | 129 | 460 |
| 2024 | 340 | 4 | 92 | 137 | 20 | 91 | 297 |
| 2025 | 470 | 6 | 11 | 406 | 25 | 28 | 424 |
| 2026 | 265 | 5 | 3 | 151 | 48 | 63 | 226 |
3–4 unit buildings are buildings or projects of three or four homes: the Census “3–4 family” class (104), plus permits whose description names a triplex or fourplex. Since HOME (2024) they are mostly three-unit lots, each home its own attached, usually three-story townhome; before it, mostly for-sale townhome and condo rows, with about one in four a 3–4 unit rental building inside a garden-apartment complex. Attached single-family homes (townhouses and rowhouses on their own lots, which Austin files under the one-family class) are counted separately.
The attached single-family column is read from permit descriptions, because Austin files townhouses under the same Census class as detached houses and the appraisal roll has no townhouse code at all. The window total is sound, but there is no second ledger to check it against and the year-to-year figures move with how permits happen to be worded — read the level, not the trend.
Where infill lands, by base zoning district
60% of missing-middle homes land in SF districts — the single-family land HOME was written to open up. The next largest is PUD at 22%.
| District | Homes | Permits | Share |
|---|---|---|---|
| SF | 4,519 | 3,799 | 1 |
| PUD | 1,654 | 1,377 | 0 |
| MF | 450 | 331 | 0 |
| UNZONED / NO MATCH | 257 | 203 | 0 |
| GR | 202 | 128 | 0 |
| CS | 103 | 65 | 0 |
| GO | 76 | 69 | 0 |
| RR | 71 | 71 | 0 |
Top infill permit holders
Who is actually doing the small-scale work, by homes permitted over the window. Last 12 mo sits beside it so a name that has stopped is visible as one — several of the largest have pulled nothing recently.
| Builder | Homes | Permits | Last 12 mo | Mainly builds | Share |
|---|---|---|---|---|---|
| Milestone Community Builders, LLC | 500 | 344 | 18 | 3–4 unit buildings | 6.9% |
| David Weekley Homes | 330 | 319 | 0 | Attached single-family (townhouse/rowhouse) | 4.5% |
| Shreve Land Constructors LLC | 214 | 214 | 0 | Duplex | 2.9% |
| HOMES by AVI (Texas) LP | 184 | 127 | 0 | Duplex | 2.5% |
| Prominence Homes, LLC MAIN | 182 | 177 | 0 | Attached single-family (townhouse/rowhouse) | 2.5% |
| D R Horton Homes | 154 | 124 | 0 | Duplex | 2.1% |
| Pecan Valley Homes LLC MAIN | 144 | 126 | 4 | ADU / secondary | 2.0% |
| CalAtlantic Homes | 141 | 141 | 0 | Attached single-family (townhouse/rowhouse) | 1.9% |
| Lennar Homes of Texas MAIN | 129 | 129 | 0 | Attached single-family (townhouse/rowhouse) | 1.8% |
| Precise Custom Homes Inc. | 110 | 103 | 0 | ADU / secondary | 1.5% |
| Ash Creek Homes, Inc. | 70 | 70 | 0 | Attached single-family (townhouse/rowhouse) | 1.0% |
| SVAG Construction MAIN | 70 | 36 | 1 | Duplex | 1.0% |
Infill is concentrated: the top name alone is 6.9% of homes, and permit counts run well above homes for the duplex builders because each half is now permitted separately.
Who is building
Most active permit holders
Ranked by homes permitted, on the share of permits that name a contractor. Corporate families are not merged, so a builder operating under several entities appears more than once.
Top builders by homes
| Builder | Homes | Permits | Mainly builds | Share of named |
|---|---|---|---|---|
| OHT Construction LLC MAIN | 798 | 23 | apartment | 12.7% |
| GS Construction Midsouth, LLC | 426 | 6 | apartment | 6.8% |
| NRP Contractors II, LLC | 341 | 6 | apartment | 5.4% |
| Morgan PRL Construction LLC | 315 | 10 | apartment | 5.0% |
| Journeyman Construction | 310 | 16 | apartment | 4.9% |
| The NRP Contractors, LLC | 306 | 5 | apartment | 4.9% |
| Westwood Residential Builders 85, a rexas Limited partnership | 306 | 8 | apartment | 4.9% |
| Dominion Construction, LLC | 287 | 3 | apartment | 4.6% |
| Skybeck Construction, LLC | 236 | 2 | apartment | 3.8% |
| Ryan Companies US INC | 232 | 3 | apartment | 3.7% |
| Summit Design Build | 215 | 1 | apartment | 3.4% |
| ICON Builders, LLC | 208 | 2 | apartment | 3.3% |
| Builder | Homes | Permits | Mainly builds | Share of named |
|---|---|---|---|---|
| OHT Construction LLC MAIN | 786 | 20 | apartment | 16.6% |
| GS Construction Midsouth, LLC | 426 | 6 | apartment | 9.0% |
| NRP Contractors II, LLC | 341 | 6 | apartment | 7.2% |
| Journeyman Construction | 310 | 16 | apartment | 6.6% |
| Westwood Residential Builders 85, a rexas Limited partnership | 306 | 8 | apartment | 6.5% |
| The NRP Contractors, LLC | 306 | 5 | apartment | 6.5% |
| Morgan PRL Construction LLC | 295 | 3 | apartment | 6.2% |
| Dominion Construction, LLC | 287 | 3 | apartment | 6.1% |
| Skybeck Construction, LLC | 236 | 2 | apartment | 5.0% |
| Ryan Companies US INC | 232 | 3 | apartment | 4.9% |
| Summit Design Build | 215 | 1 | apartment | 4.6% |
| ICON Builders, LLC | 208 | 2 | apartment | 4.4% |
| Builder | Homes | Permits | Mainly builds | Share of named |
|---|---|---|---|---|
| Milestone Community Builders, LLC | 116 | 110 | detached | 7.4% |
| New Home Co | 82 | 82 | detached | 5.2% |
| Century Land Holdings II, LLC | 75 | 75 | detached | 4.8% |
| Trophy Signature Homes | 56 | 56 | detached | 3.6% |
| Joseph Design Build MAIN | 54 | 54 | detached | 3.4% |
| Meritage Homes Corp | 46 | 46 | detached | 2.9% |
| David Weekley Homes | 43 | 43 | detached | 2.7% |
| Paradisa Homes, LLC MAIN | 42 | 42 | detached | 2.7% |
| St. Stephens Build, LLC | 36 | 36 | detached | 2.3% |
| D R Horton Homes | 33 | 33 | detached | 2.1% |
| Hoch Construction LLC. | 33 | 33 | detached | 2.1% |
| Eastside Construction Company LLC | 31 | 31 | duplex | 2.0% |
| Builder | Homes | Permits | Mainly builds | Share of named |
|---|---|---|---|---|
| OHT Construction LLC MAIN | 13,552 | 288 | apartment | 9.9% |
| Journeyman Construction | 6,462 | 183 | apartment | 4.7% |
| Skybeck Construction, LLC | 5,499 | 123 | apartment | 4.0% |
| GS Construction Midsouth, LLC MAIN | 3,969 | 60 | apartment | 2.9% |
| D R Horton Homes | 3,845 | 3,818 | detached | 2.8% |
| Oden Hughes LLC dba Cactus Rose Oh Delta LLC | 3,448 | 108 | apartment | 2.5% |
| Milestone Community Builders, LLC | 2,520 | 1,772 | detached | 1.8% |
| The NRP Group LLC | 2,499 | 71 | apartment | 1.8% |
| Andres Construction | 1,972 | 28 | apartment | 1.4% |
| KB Home | 1,948 | 1,952 | detached | 1.4% |
| JE Dunn Construction MAIN | 1,859 | 6 | apartment | 1.4% |
| Provident General Contractors | 1,855 | 22 | apartment | 1.4% |
| Builder | Homes | Permits | Mainly builds | Share of named |
|---|---|---|---|---|
| OHT Construction LLC MAIN | 13,488 | 266 | apartment | 12.7% |
| Journeyman Construction | 6,452 | 178 | apartment | 6.1% |
| Skybeck Construction, LLC | 5,489 | 118 | apartment | 5.2% |
| GS Construction Midsouth, LLC MAIN | 3,969 | 60 | apartment | 3.8% |
| Oden Hughes LLC dba Cactus Rose Oh Delta LLC | 3,415 | 98 | apartment | 3.2% |
| The NRP Group LLC | 2,483 | 63 | apartment | 2.4% |
| Andres Construction | 1,972 | 28 | apartment | 1.9% |
| JE Dunn Construction MAIN | 1,859 | 6 | apartment | 1.8% |
| Provident General Contractors | 1,855 | 22 | apartment | 1.8% |
| Rampart Multifamily | 1,835 | 43 | apartment | 1.7% |
| AMLI Development Company, LLC | 1,776 | 33 | apartment | 1.7% |
| Bartlett Cocke General Contractors | 1,709 | 25 | apartment | 1.6% |
| Builder | Homes | Permits | Mainly builds | Share of named |
|---|---|---|---|---|
| D R Horton Homes | 3,845 | 3,818 | detached | 12.3% |
| KB Home | 1,948 | 1,952 | detached | 6.2% |
| Milestone Community Builders, LLC | 1,817 | 1,673 | detached | 5.8% |
| Lennar Homes of Texas MAIN | 1,439 | 1,440 | detached | 4.6% |
| David Weekley Homes | 1,225 | 1,214 | detached | 3.9% |
| CalAtlantic Homes | 1,153 | 1,153 | detached | 3.7% |
| Pulte Homes of Texas L.P. dba Pulte Group | 943 | 943 | detached | 3.0% |
| RSI Communities (DO NOT USE) | 797 | 797 | detached | 2.6% |
| M-I Homes of Austin, LLC | 469 | 469 | detached | 1.5% |
| Century Land Holdings II, LLC | 426 | 426 | detached | 1.4% |
| Paradisa Homes, LLC MAIN | 417 | 402 | detached | 1.3% |
| Urban Intown Homes LLC | 393 | 394 | detached | 1.3% |
Multifamily means the 5+ and mixed-use classes — apartment-scale work. Everything else is detached, ADU, duplex, attached single-family and 3–4 unit buildings, a different business that the combined table hides behind apartment general contractors.
Geography
Where new housing is landing
Density of homes per square mile by ZIP. Densest area in Austin is 78701 at 266 homes per square mile.
Density of homes per square mile by ZIP. Densest area in Austin is 78701 at 4,334 homes per square mile.
Homes per square mile
last 12 months 2016–2026Top ZIPs by homes
| ZIP | Homes | Permits | Multifamily | Per sq mi |
|---|---|---|---|---|
| 78702 | 753 | 117 | 86% | 147 |
| 78758 | 597 | 30 | 96% | 63 |
| 78752 | 459 | 37 | 94% | 147 |
| 78701 | 447 | 4 | 100% | 266 |
| 78735 | 404 | 21 | 100% | 21 |
| 78724 | 383 | 43 | 90% | 15 |
| 78744 | 333 | 31 | 93% | 15 |
| 78753 | 318 | 20 | 96% | 30 |
| 78736 | 315 | 10 | 100% | 16 |
| 78660 | 310 | 16 | 100% | 7 |
| 78745 | 289 | 185 | 40% | 22 |
| 78704 | 248 | 145 | 45% | 29 |
| ZIP | Homes | Permits | Multifamily | Per sq mi |
|---|---|---|---|---|
| 78702 | 9,753 | 2,046 | 81% | 1,899 |
| 78758 | 8,649 | 281 | 98% | 916 |
| 78723 | 8,309 | 2,382 | 74% | 1,165 |
| 78741 | 7,869 | 1,180 | 87% | 997 |
| 78701 | 7,290 | 32 | 100% | 4,334 |
| 78745 | 6,642 | 1,593 | 80% | 505 |
| 78754 | 6,224 | 2,653 | 63% | 437 |
| 78705 | 5,958 | 198 | 98% | 3,196 |
| 78753 | 5,749 | 506 | 94% | 546 |
| 78747 | 5,718 | 2,738 | 56% | 282 |
| 78724 | 5,563 | 1,502 | 76% | 217 |
| 78744 | 5,446 | 1,835 | 68% | 239 |
A ZIP is a postal delivery area, not a neighborhood. These boundaries cross the city limit; the permits counted inside them do not.
Explore neighborhoods with our interactive permit map
Draw any area and read its whole permit history — new homes, demolitions, remodels and additions, on one timeline.
Try it now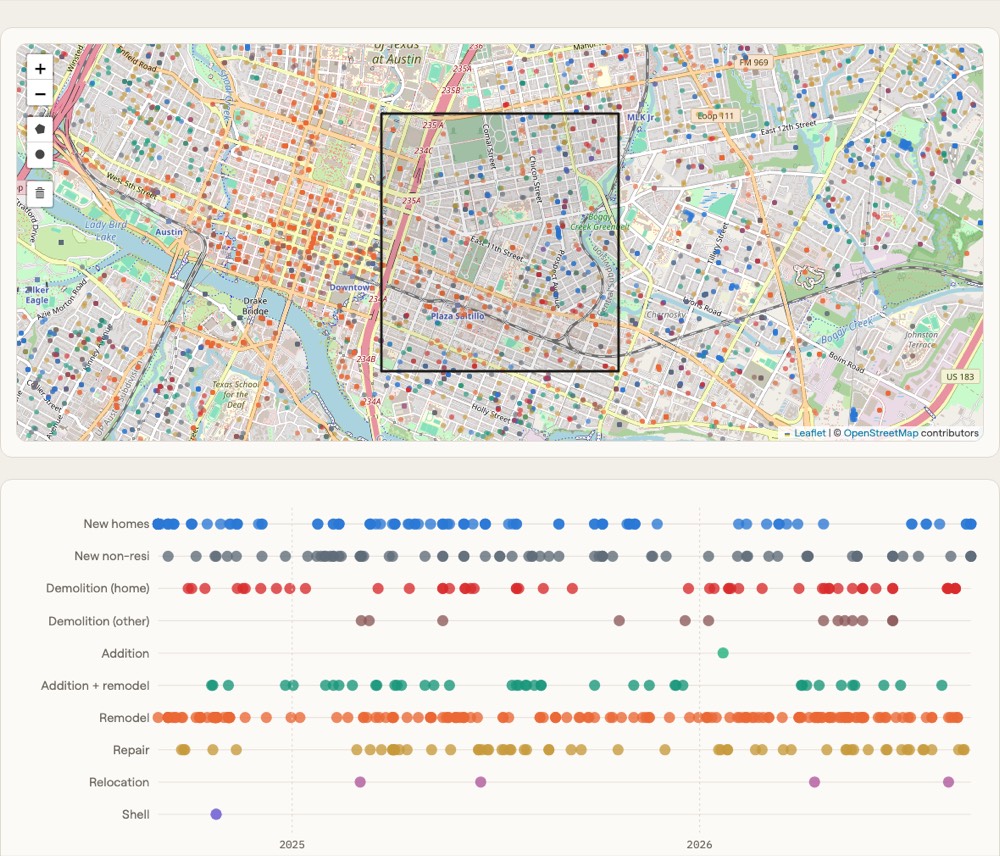
Land & building
Zoning, lots and building size
Zoning is the district each parcel sits in today. Austin publishes no parcel-level rezoning history, so read this as what has been built on land now zoned that way.
Homes by base zoning district
| District | Homes | Permits |
|---|---|---|
| MF | 21,794 | 2,006 |
| SF | 21,539 | 20,700 |
| CS | 21,511 | 505 |
| PUD | 16,801 | 5,291 |
| GR | 16,298 | 1,033 |
| NBG | 7,045 | 64 |
| CBD | 6,340 | 25 |
| UNZONED / NO MATCH | 5,296 | 1,036 |
| TOD | 5,006 | 186 |
| LI | 4,346 | 542 |
Typical lot, by form
| Form | Parcels | Frontage ft | Depth ft | Lot p25 | Lot median | Lot p75 |
|---|---|---|---|---|---|---|
| detached | 17,069 | 52 | 121 | 5,281 | 6,325 | 8,002 |
| adu | 968 | 57 | 140 | 6,636 | 7,782 | 9,857 |
| Attached single-family (townhouse/rowhouse) | 533 | 28 | 86 | 1,650 | 2,182 | 3,094 |
| apartment | 446 | 279 | 461 | 46,048 | 121,196 | 165,051 |
| duplex | 443 | 70 | 146 | 7,295 | 9,228 | 12,711 |
| mixed_use | 30 | 341 | 431 | 75,008 | 88,188 | 152,978 |
| 3–4 unit buildings | 23 | 74 | 151 | 7,712 | 11,970 | 12,798 |
A detached lot runs about 52 × 121 ft on 6,325 sq ft; an apartment site about 2.8 acres. Frontage is derived from parcel geometry — a distribution, not a survey.
Single-family floor area by year · permits ledger
| Year | Permits | p25 | Median | p75 | p90 |
|---|---|---|---|---|---|
| 2016 | 3,360 | 2,053 | 2,542 | 3,186 | 3,805 |
| 2017 | 3,823 | 1,986 | 2,472 | 3,057 | 3,771 |
| 2018 | 3,651 | 2,001 | 2,473 | 2,982 | 3,580 |
| 2019 | 3,718 | 1,946 | 2,449 | 2,982 | 3,532 |
| 2020 | 3,115 | 1,996 | 2,442 | 2,905 | 3,677 |
| 2021 | 3,042 | 2,032 | 2,519 | 3,059 | 3,775 |
| 2022 | 2,576 | 2,144 | 2,648 | 3,186 | 4,146 |
| 2023 | 1,546 | 1,909 | 2,609 | 3,276 | 4,313 |
| 2024 | 1,369 | 2,045 | 2,558 | 3,261 | 4,220 |
| 2025 | 1,349 | 1,857 | 2,384 | 3,135 | 4,420 |
| 2026 | 1,426 | 2,078 | 2,574 | 3,136 | 4,259 |
Building in Austin?
Try our AI-powered CedarOS to move through feasibility and zoning faster and with fewer surprises.
Learn More
Approvals
How long a permit takes
Days from application to issued permit, full window. The application date is unusable before 2013, so the series cannot start earlier.
Days to issue
By form
| Form | Permits with a review time | Median days | Slowest 10% | Median homes | Days per home |
|---|---|---|---|---|---|
| Detached house | 24,313 | 31 | 157 | 1 | 31 |
| Attached single-family (townhouse/rowhouse) | 1,623 | 39 | 262 | 1 | 39 |
| Duplex | 1,658 | 76 | 356 | 2 | 49 |
| ADU / secondary | 2,660 | 97 | 280 | 1 | 96 |
| 3–4 unit buildings | 236 | 128 | 483 | 3 | 72 |
| Apartment (5+) | 2,182 | 246 | 655 | 31 | 8 |
| Mixed use | 38 | 769 | 1,011 | 6 | 128 |
The last two columns rank the forms oppositely. By absolute wait apartments are slowest at 246 days; per home delivered they are the fastest, because one review yields about 31 homes. An ADU takes 96.0 days for a single home.
Completions
Homes finished
What the county appraisal roll says was finished, by the year built it records: a separate record from the permits above, never mixed with them. Condos are counted by unit, as the roll records them. The newest years are still being assessed.
Homes finished, by year built and form
This market counts condos by unit, not by building, so condo bars here are units.
| Year built | Detached house | Attached single-family | 2–4 homes | Condo building | Manufactured | ADU | All |
|---|---|---|---|---|---|---|---|
| 2016 | 1,669 (1,669) | 192 (192) | 42 (21) | 1,425 (1,425) | 4 (4) | 127 (127) | 3,459 (3,438) |
| 2017 | 1,923 (1,923) | 124 (124) | 52 (25) | 1,475 (1,475) | 6 (6) | 124 (124) | 3,704 (3,677) |
| 2018 | 1,904 (1,904) | 59 (59) | 22 (11) | 2,799 (2,799) | 3 (3) | 145 (145) | 4,932 (4,921) |
| 2019 | 2,299 (2,299) | 67 (67) | 24 (12) | 2,044 (2,044) | 5 (5) | 164 (164) | 4,603 (4,591) |
| 2020 | 1,952 (1,952) | 40 (40) | 12 (6) | 1,169 (1,169) | 6 (6) | 195 (195) | 3,374 (3,368) |
| 2021 | 2,059 (2,059) | 42 (42) | 52 (26) | 1,830 (1,830) | 4 (4) | 160 (160) | 4,147 (4,121) |
| 2022 | 1,946 (1,946) | 161 (161) | 40 (20) | 1,173 (1,173) | – | 277 (277) | 3,597 (3,577) |
| 2023 | 967 (967) | 88 (88) | 43 (20) | 1,084 (1,084) | 2 (2) | 230 (230) | 2,414 (2,391) |
| 2024 | 735 (735) | 8 (8) | 39 (16) | 485 (485) | 10 (10) | 126 (126) | 1,403 (1,380) |
| 2025 * | 856 (856) | 3 (3) | 239 (119) | 280 (280) | 2 (2) | 164 (164) | 1,544 (1,424) |
| 2026 * | 23 (23) | – | – | 1 (1) | – | 6 (6) | 30 (30) |
Homes (buildings). * still being assessed. Condos are counted by unit here, so their buildings are units.
Apartments are not shown. The appraisal roll records neither their unit counts nor comparable building counts: from 2024 its "apartment" improvements are mostly small structures on multifamily land, not complexes. Multifamily volume is in the permits ledger (Production, Pipeline).
Pipeline
Permitted versus finished
Two independent records — the city's permits, and the county appraisal roll's year built. Never mixed, and they cross-check each other.
Homes permitted and homes assessed complete
| Year | Permitted | Assessed complete |
|---|---|---|
| 2016 | 9,820 | 3,459 |
| 2017 | 10,055 | 3,704 |
| 2018 | 11,188 | 4,932 |
| 2019 | 16,759 | 4,603 |
| 2020 | 18,509 | 3,374 |
| 2021 | 16,883 | 4,147 |
| 2022 | 18,873 | 3,597 |
| 2023 | 13,637 | 2,414 |
| 2024 | 8,329 | 1,403 |
| 2025 | 8,339 | 1,544 |
| 2026 | 5,589 | 30 |
The appraisal roll trails by a year or more, so the newest two years always understate what was finished. Completed apartment units are not available at all — the roll records structures, not dwelling counts — so this column covers only forms whose size is fixed by their type.
Data sources
What this is built from
6 public datasets, 767 MB, pulled 2 Sep–9 Nov 2026. 4 of 6 carry their publisher's latest; Zoning districts has moved on 6 days since; Jurisdiction boundaries has moved on 6 days since we pulled it. Each publisher was checked live when this page was generated.
Issued construction permits
currentEvery building permit issued by the city, 1980 to date. The permits ledger: what was authorised, when, of what form and how many homes.
TCAD appraisal export (roll 2026, supplement 1, run 2026-08-05)
currentThe certified appraisal roll. Supplies the completions ledger (year built per improvement), the taxing-entity scope, and construction attributes.
TCAD parcels
currentParcel polygons with TCAD ids. Lot geometry for frontage, depth and area, and the spatial fallback for scope.
Zoning districts
publisher 6d aheadBase zoning with overlays. Note this is CURRENT zoning — Austin publishes no parcel-level rezoning history.
Jurisdiction boundaries
publisher 6d aheadFull-purpose, limited-purpose and ETJ boundaries. Defines the study scope and keeps both ledgers on one definition of Austin.
ZIP code boundaries
currentPostal ZIP polygons, used only as containers for the massing map. They cross the city limit and are not city geography.
Texas is a non-disclosure state: no sale price exists in any of these sources, so nothing here speaks to what new housing sold for. Assessed value is not a substitute and is not used as one.
Generated 2026-11-09 from
the pipeline outputs in data/out/. Every figure on this page is read
from those files at build time, never transcribed.